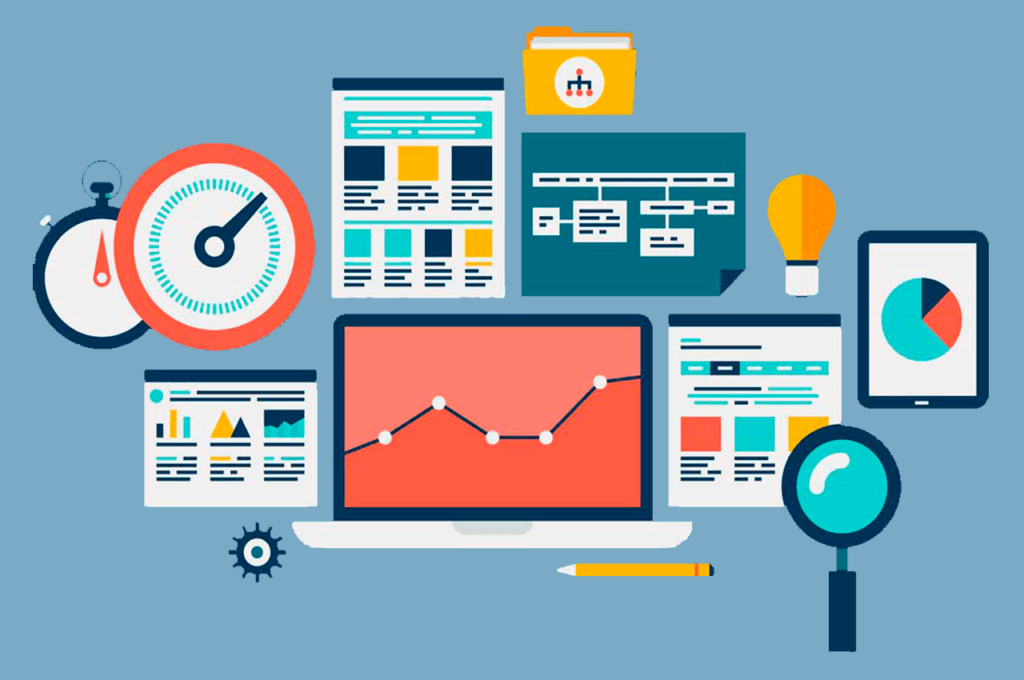
In the age of big data, the healthcare industry is generating vast amounts of information daily. From patient records and clinical trials to population health data, the need to analyze and interpret this data is more crucial than ever. That’s where data visualization comes in. Healthcare data visualization tools are revolutionizing the way hospitals, pharmaceutical companies, research institutions, and health insurance providers make decisions and deliver care.
The Rise of Healthcare Data Visualization
Statistics confirm the importance of data visualization in healthcare. The global healthcare analytics market was valued at $35.3 billion in 2022 and is projected to reach $167.0 billion by 2023. This rapid growth is a testament to the increasing reliance on data visualization to extract actionable insights from the ever-expanding pool of healthcare data.
Why Use Healthcare Data Visualization?
There are compelling reasons why healthcare data visualization is gaining popularity:
- Efficient Data Handling: The abundance of healthcare data no longer requires manual collection and tedious calculations. Data visualization tools streamline data collection and automate calculations.
- Improved Patient Outcomes: Visualizing data helps healthcare professionals identify trends and patterns, which informs treatment decisions and ultimately improves patient care. Early intervention for high-risk patients is a prime example.
- Enhanced Efficiency: Data visualization exposes areas for improvement, optimizing resource utilization and reducing costs. For instance, it can track hospital bed and medical equipment usage to reduce expenses.
Types of Healthcare Data Visualization
Healthcare data can take various forms, including:
- Charts and Graphs: Ideal for representing numerical data such as patient demographics or disease incidence rates.
- Diagrams and Flowcharts: Used to illustrate processes like clinical trial steps.
- Tables: Present large volumes of data in a structured format.
- Maps: Reveal geographical patterns in disease incidence or resource utilization.
- Infographics: Simplify complex information for easy understanding.
- Dashboards: Offer an at-a-glance view of key metrics for quick decision-making.
Benefits of Healthcare Data Visualization
The long-term benefits of healthcare data visualization are numerous:
- Improved Decision-Making: Analyzing large datasets quickly enhances decision-making processes. For example, AI-based visualization tools have helped healthcare companies identify high-risk patients and reduce readmissions.
- Operational Efficiency: Healthcare organizations can optimize operations using visualization tools. Real-time information sharing can lead to improvements in care quality and cost savings.
- Population Health Trends: By analyzing personal health data, healthcare organizations can detect emerging health issues and target interventions more effectively.
- Stakeholder Engagement: Data visualization can drive collaboration in public health initiatives, like the CDC’s National Syndromic Surveillance Program.
- Patient Education: Visualizations are used in health apps to raise awareness and improve patient knowledge about specific conditions.
- Cost Savings: By analyzing healthcare expenditures, organizations can identify inefficiencies and reduce wasteful spending, improving financial sustainability.
Sources of Medical Data for Visualization
Healthcare data comes from diverse sources:
- Electronic Health Records (EHR) and Electronic Medical Records (EMR): These systems contain patient histories, diagnoses, lab results, and more.
- Data Collection Forms: Reports, scorecards, and patient self-reporting forms offer valuable data.
- Clinical Trials: These trials generate comprehensive health information.
- Wearable and Portable Devices: Devices like fitness trackers and biosensors capture vital health data.
- Third-Party Platforms: Aggregated data from multiple healthcare providers allows for comparative analysis.
Popular Healthcare Data Visualization Tools
Several tools make healthcare data visualization easy:
- Tableau: A leading data analytics platform with a simple drag-and-drop interface.
- Power BI: Microsoft’s business intelligence tool offering interactive dashboards and reports.
- QlikView: Provides intuitive drag-and-drop functionality and dynamic navigation for complex data.
- Looker: A cloud-based data platform for accessing, exploring, and visualizing medical data.
- Plotly: An open-source library for creating personalized visualizations.
Challenges and How to Overcome Them
Healthcare organizations face challenges, including data unification, fragmentation, and the lack of data visualization training. Overcoming these challenges involves investing in integrated data solutions and fostering collaboration among departments.
Implementing Healthcare Data Visualization Software
Implementing software for healthcare data visualization involves several steps, including research, integration, and development. Collaborating with experienced developers can help create effective visualization tools.
Why Choose Viceroy Solutions for Healthcare Data Visualization
Viceroy Solutions offers extensive experience in healthcare data visualization, creating interactive dashboards and reporting systems. Their customized solutions enable healthcare providers to gain valuable insights from their data.
Conclusion
Data visualization is indispensable in the healthcare industry, offering insights that drive informed decisions and improve patient outcomes. Embracing data visualization today lays the foundation for success in a data-centric future. Healthcare organizations that invest in advanced analytics and data visualization solutions will gain a competitive edge and provide better care to their patients.


